
IoT Dashboard using Node-RED: design guide
Introduction
In the world of IoT, it’s not just about connecting devices — it’s about visualizing data in real-time, making decisions, and triggering actions. This is where Node-RED becomes a game-changer.
Node-RED is an open-source, flow-based development tool created by IBM that allows developers to wire together hardware devices, APIs, and online services. With its low-code, drag-and-drop interface, it’s ideal for rapidly developing IoT applications and dashboards even if you’re not a seasoned programmer.
In this comprehensive tutorial, you’ll learn how to:
- Install and set up Node-RED
- Connect an MQTT broker (public or local)
- Simulate IoT sensor data
- Build a real-time dashboard to visualize data
- Extend functionality with charts, switches, and more
By the end, you’ll be ready to create your own IoT monitoring system.
What You’ll Need
Before we dive into building, make sure you have the following:
Software Requirements:
- Node.js (v14 or higher): Required for installing Node-RED
- Node-RED: Open-source visual programming tool
- Internet Browser: Chrome or Firefox for accessing the dashboard UI
- Command Line Tool: Terminal/Command Prompt to run Node-RED
Optional Tools:
- MQTT Broker: Public (like HiveMQ) or local (Mosquitto)
- MQTT Client Tool: Like MQTT.fx or MQTT Explorer
- ESP8266/ESP32: If you want to test with real devices later
Step 1: Installing Node-RED
1.1 Install Node.js
- Go to https://nodejs.org and download the LTS version.
- Complete the installation using default settings.
1.2 Install Node-RED
Once Node.js is installed, open your terminal or command prompt:
npm install -g --unsafe-perm node-red
This will globally install Node-RED on your system.
1.3 Launch Node-RED
Run the following command:
node-red
You should see logs showing that Node-RED is running. Open your browser and navigate to:
http://localhost:1880
You’ll see the Node-RED Flow Editor, a visual canvas where you’ll create your IoT flows.
Tip: On Raspberry Pi, Node-RED is already pre-installed in Raspberry Pi OS. Just run node-red-start in terminal.
Step 2: Setting Up an MQTT Broker
For this tutorial, we’ll use HiveMQ’s free public broker: broker.hivemq.com. You can also set up a local broker using Mosquitto.
2.1 Test Public MQTT Broker
No installation needed. Just use the broker address:
- Broker Address:
broker.hivemq.com - Port:
1883
2.2 Optional: Install Local Broker (Mosquitto)
If you want full control or plan to go offline:
For Ubuntu/Linux:
sudo apt update
sudo apt install mosquitto mosquitto-clients
For Windows/macOS: Download from https://mosquitto.org/download/
You can now subscribe and publish using:
mosquitto_sub -h localhost -t test/topic
Step 3: Simulate Sensor Data in Node-RED
Let’s now simulate some temperature and humidity sensor data.
3.1 Add Inject Node
- Drag an Inject node from the left panel
- Double-click to configure:
- Set Payload type to
JSON - Enter:
- Set Payload type to
{
  "temperature": 28,
  "humidity": 65
}
- Set Repeat interval to
every 5 seconds
3.2 Add MQTT Out Node
- Drag an MQTT Out node
- Double-click and click edit on the server field
- Server:
broker.hivemq.com - Port:
1883
- Server:
- Set Topic:
iotdunia/sensors/data - Connect Inject → MQTT Out
- Click Deploy
Your simulated sensor data is now being published every 5 seconds!
Step 4: Receive & Parse Sensor Data
Now let’s subscribe to the data and use it to build the dashboard.
4.1 Add MQTT In Node
- Drag an MQTT In node
- Server:
broker.hivemq.com - Topic:
iotdunia/sensors/data
4.2 Add JSON Parser
- Drag a JSON node
- Connect it to the MQTT In node
4.3 Add Debug Node
- Drag a Debug node and connect it to the JSON parser
- Click Deploy and observe the incoming messages in the debug tab
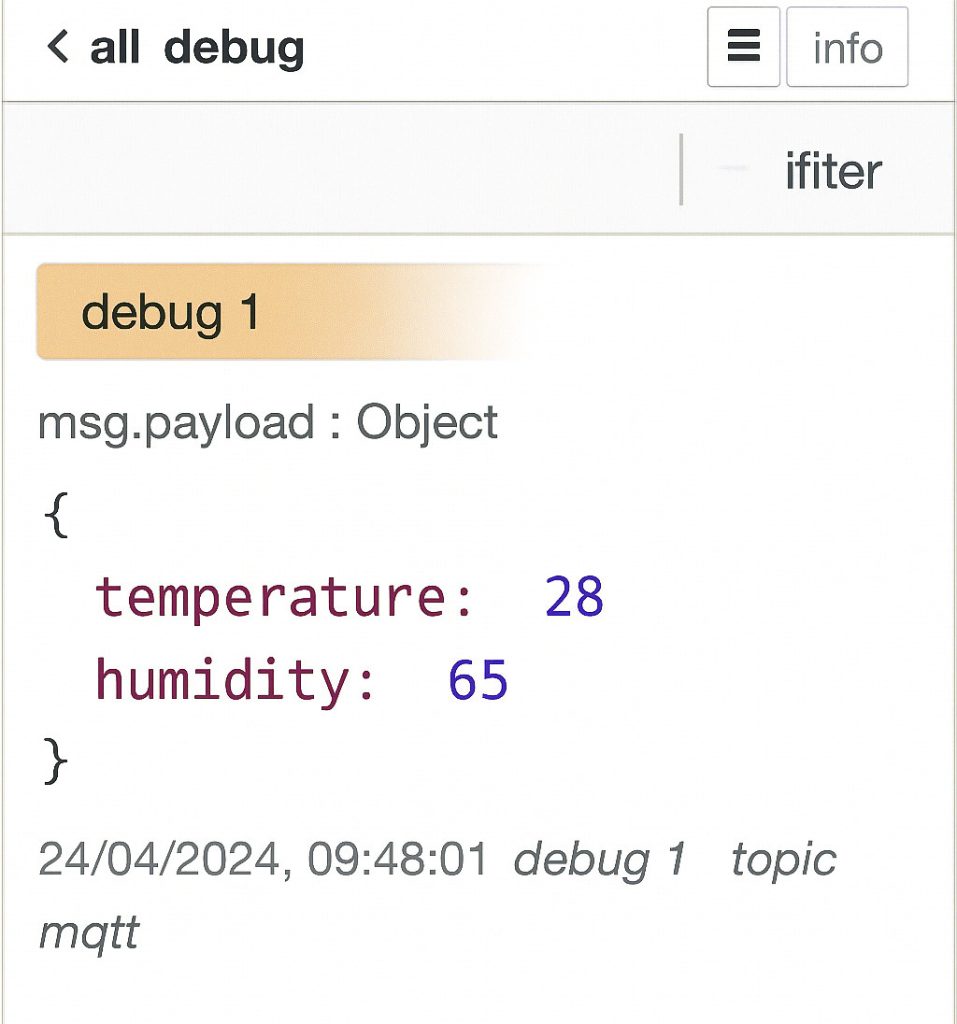
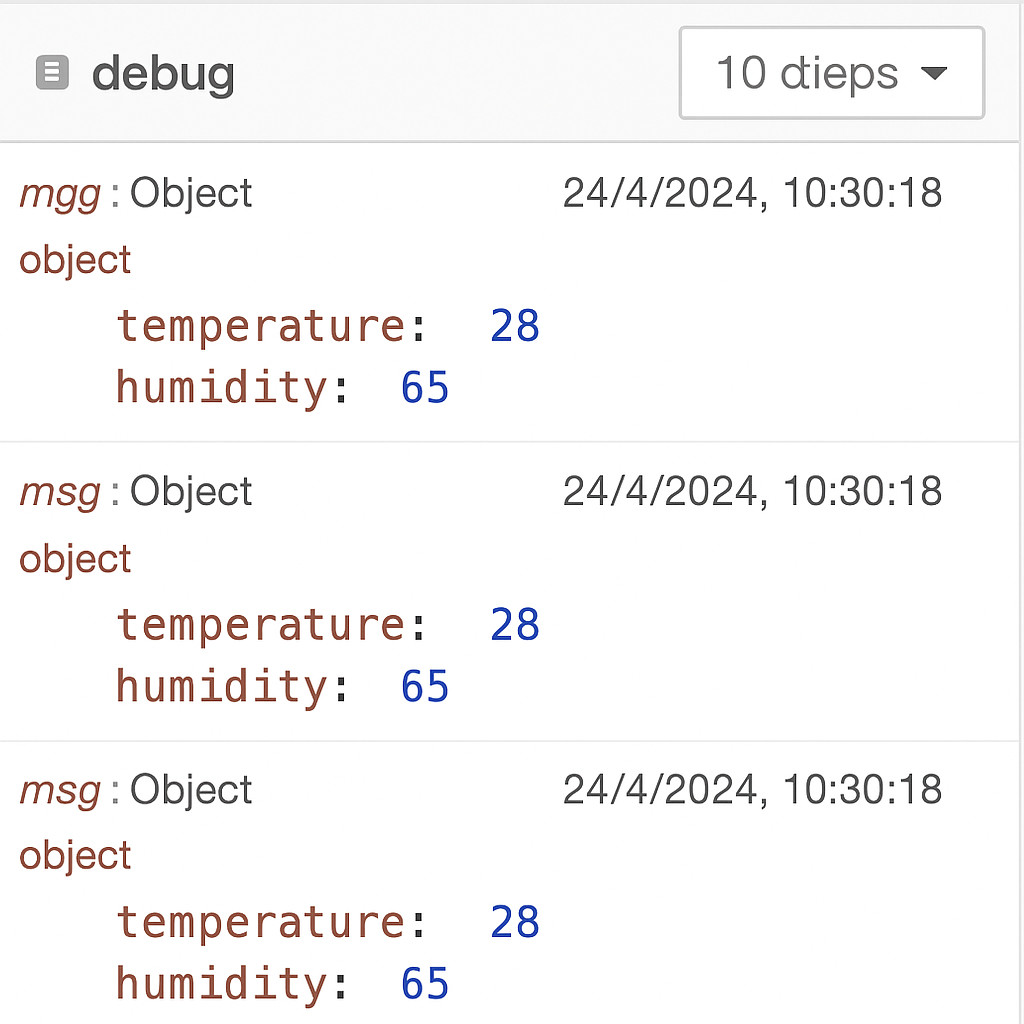
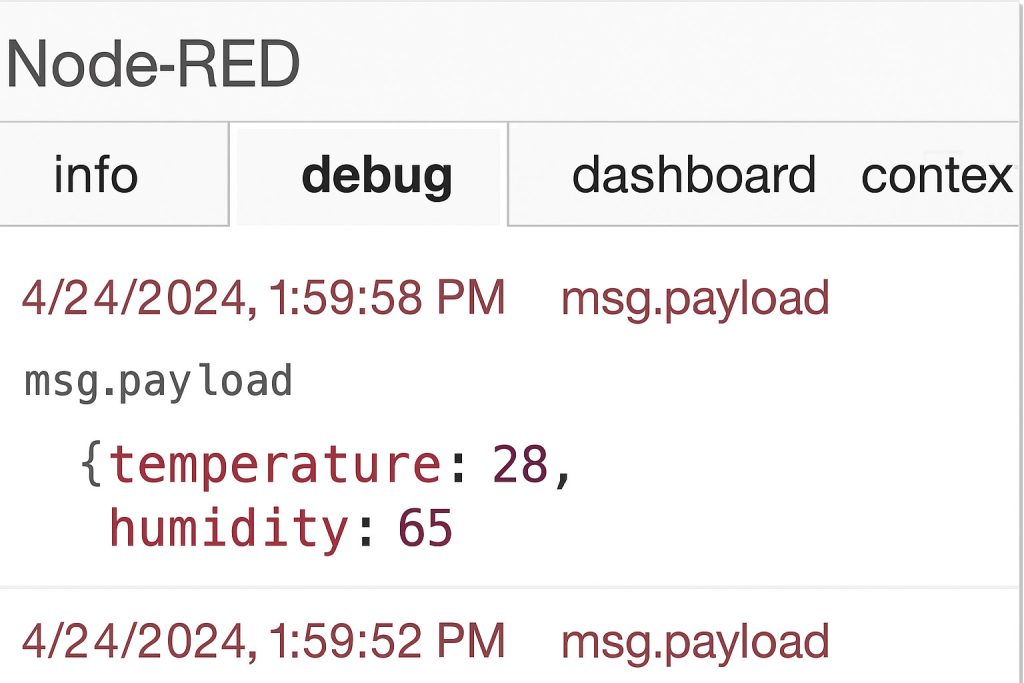
You’ll now see parsed JSON data like:
{
  temperature: 28,
  humidity: 65
}
Step 5: Build the Dashboard
We’ll now turn this data into live visualizations.
5.1 Install Dashboard Nodes
If not already installed:
cd ~/.node-red
npm install node-red-dashboard
Restart Node-RED.
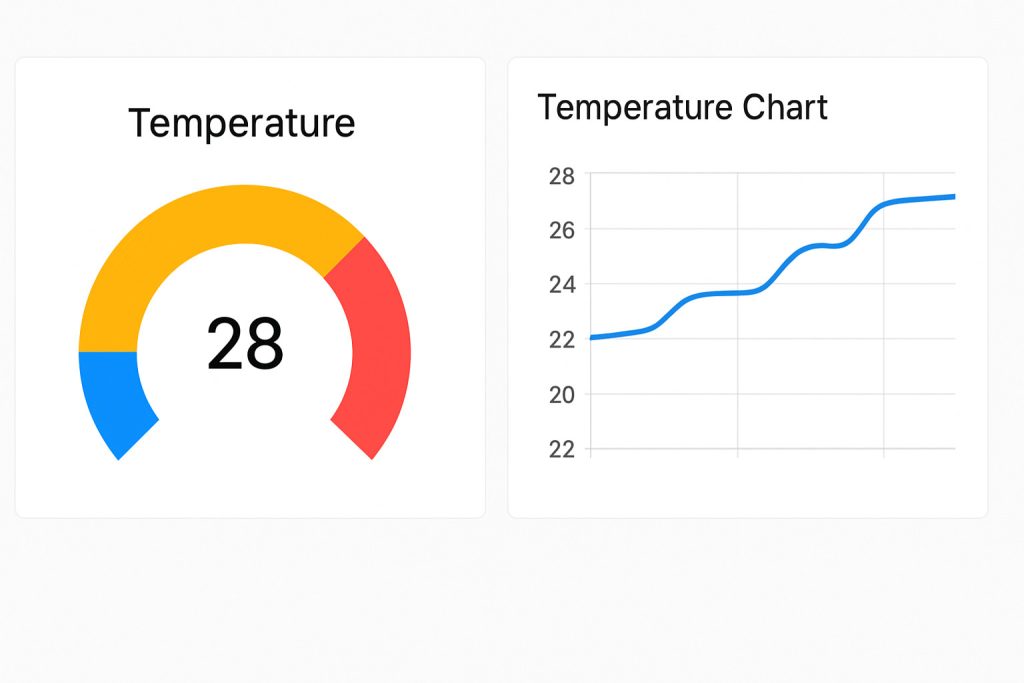
5.2 Add Gauge for Temperature
- Drag a gauge node
- Set Label:
Temperature (°C) - Range:
0–100 - Connect it to the JSON node with a function node in between
5.3 Add Function Node to Extract Data
- Drag a Function node
- Name:
Extract Temp - Code:
msg.payload = msg.payload.temperature;
return msg;
- Connect JSON → Function → Gauge
5.4 Add Chart for Historical Data
- Drag a Chart node
- Set Label:
Temperature Trend - Connect the same
Extract Tempfunction node to it
Repeat for humidity if desired.
5.5 Configure UI Tabs
Click on any UI node → Select Dashboard Tab and Group. Name them like:
- Tab:
IoTDunia Dashboard - Group:
Sensor Readings
5.6 View the Live Dashboard – IoT Dashboard using Node-RED
Open your browser:
http://localhost:1880/ui
You’ll see real-time updating gauges and charts showing your sensor data.
Screenshots & Visual Aids
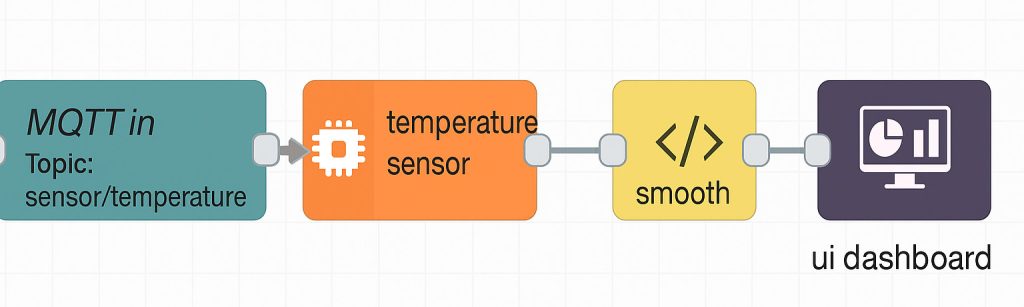
Screenshot 1: Flow Editor with Inject → MQTT → MQTT In → Dashboard nodes

Screenshot 2: Debug tab with JSON output
Screenshot 3: Dashboard UI with real-time gauges and charts
Screenshot 4: showing gauge updates in real-time
Bonus Ideas to Extend
Here are some ways to expand your project:
- Add real hardware (ESP32/ESP8266) to send real sensor data via MQTT
- Trigger email or WhatsApp alerts if temperature > threshold
- Use Node-RED UI buttons to turn devices ON/OFF remotely
- Store data into a database (InfluxDB, Firebase, or MySQL)
- Integrate with Telegram Bot or Google Assistant
Conclusion
You’ve successfully built a real-time IoT dashboard using Node-RED. This is a powerful way to monitor and visualize IoT data from sensors, devices, and simulations.
Whether you’re just experimenting or building production-ready dashboards, Node-RED’s visual interface and flexible nodes make it easy to scale.
See related articles:
1. IoT Weather Station Using Node-Red as MQTT Broker
2. How to Use IoT Device Over Internet: A Beginner’s Guide
Try connecting your ESP device next.
Ready to Explore More? Let’s Build Smarter Together!
Subscribe to Our YouTube Channel » for IoT video Tutorials.
Start Learning IoT Basics Now » and What is IoT? – Introduction to IoT and IoT Architecture: 4 Essential IoT Layers Simplified for Beginners on IoTDunia.com! and Check out Top IoT Applications in Real World – Smart Use Cases 2025, IoT career guide 2025, Best Projects on IoT for Beginners
Have questions? Drop them in the comments!
Start small, stay curious, and make your world smarter—one device at a time.